In the early days of a startup, marketing is often chaotic—and that’s acceptable. You run Facebook ads, send cold emails, post on LinkedIn, and pray something works. But as your business scales, this spray‑and‑pray approach becomes a liability. You waste budget, confuse your team, and leave money on the table.
Today, user journeys are fragmented across dozens of devices, platforms, and languages. Relying on disjointed ad campaigns or isolated blog posts without an underlying framework is a recipe for high ad spend and stagnant customer acquisition.
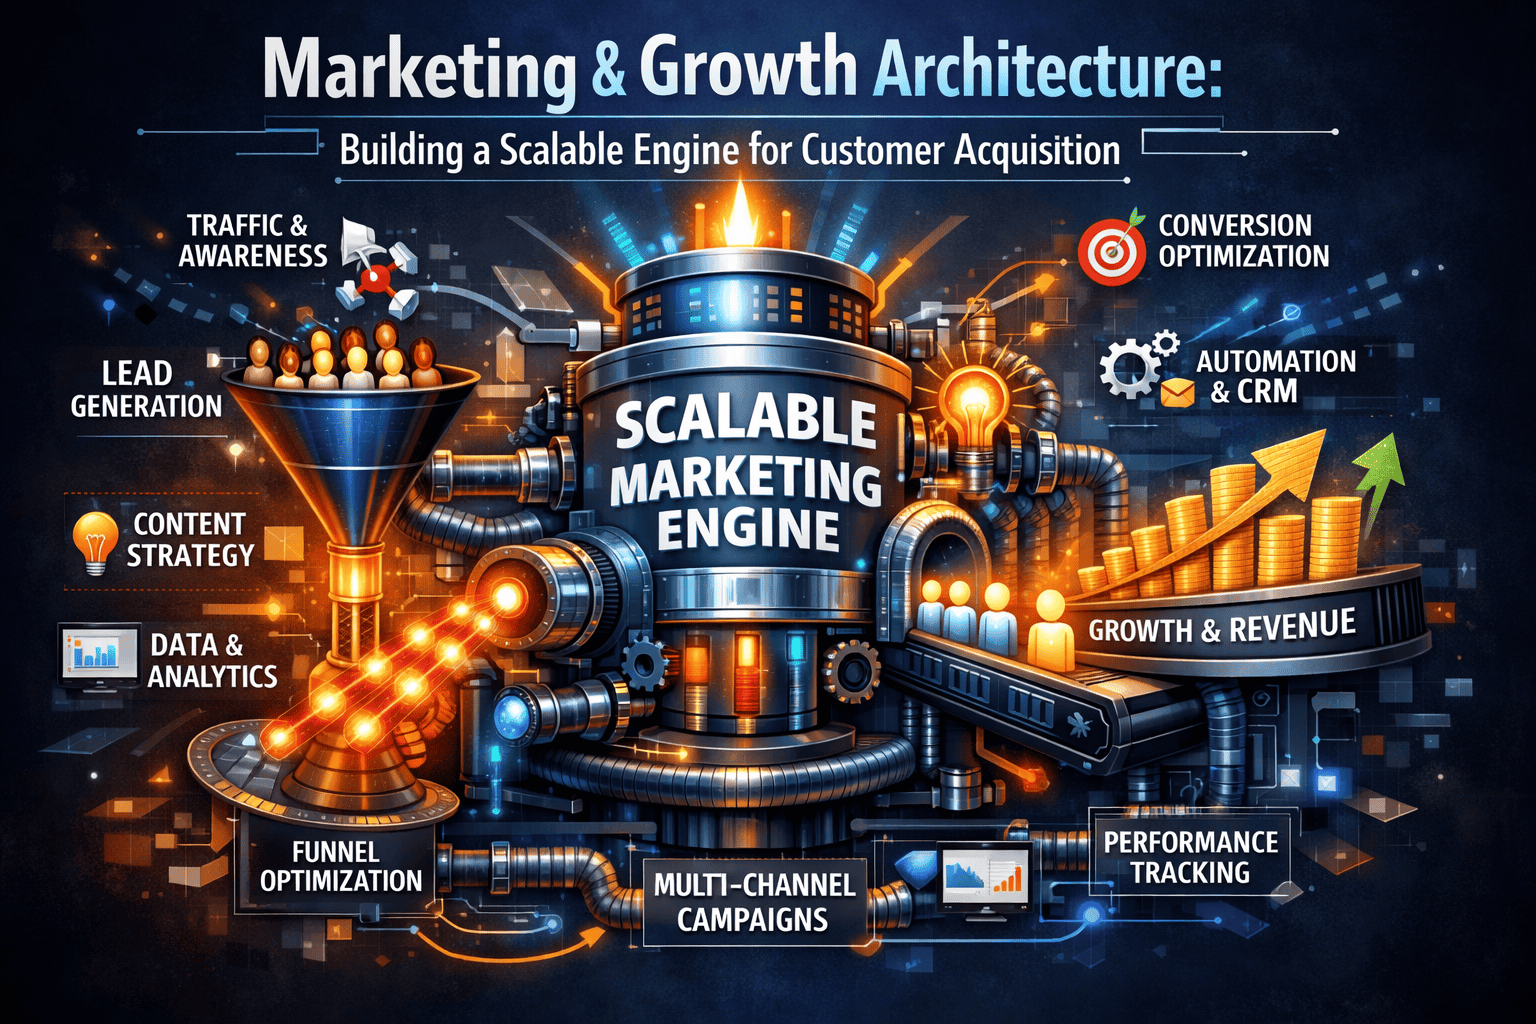
To scale predictably, modern digital companies must move beyond surface-level marketing tactics and invest in Marketing & Growth Architecture. This approach treats user acquisition, retention, and optimization as an integrated structural system.
What is Growth Architecture?
Marketing & Growth Architecture is the systematic blueprinting of your customer acquisition funnels, data pipelines, and retention loops. While traditional marketing focuses on top-of-funnel awareness (likes, impressions, and raw clicks), growth architecture views the entire user ecosystem as an engineering problem.
It bridges the gap between creative marketing copy and data-driven software engineering. An optimized growth architecture ensures that your analytics tracking, customer relationship management (CRM) software, advertising platforms, and web assets function as a single, automated engine.
A mature growth architecture includes these core layers:
| Layer | Purpose |
|---|---|
| Customer journey | Map the stages from unaware to advocate. |
| Channel strategy | Select and sequence acquisition, activation, retention, and monetization channels. |
| Data & analytics | Track, attribute, and model customer behavior. |
| Experimentation system | Run structured tests to improve metrics continuously. |
| Team & process | Define roles, workflows, and governance. |
| Technology stack | Tools for CRM, automation, analytics, and personalization. |
1. Defining Your Customer Journey: The Core Foundation
Without a unified map detailing how customers discover, evaluate, purchase, and interact with your product, your internal teams will inevitably pull in different directions. Constructing a transparent, shared customer journey aligns every department—from product development and marketing to sales and customer support—around a singular vision.
To build this foundation, you can adapt the classic AARRR (Pirate Metrics) framework to fit your specific business model:
- Awareness: The critical point where a customer first learns about your brand’s existence. Key Metrics: Total impressions, overall reach, and Cost Per Mille (CPM).
- Acquisition: The moment an interested prospect takes action and visits your website or landing page. Key Metrics: Organic and paid traffic volume, Cost Per Acquisition (CPA), and ad click-through conversion rates (CVR).
- Activation: The phase where a user engages with your tool and experiences their first true "Aha!" moment of clear value. Key Metrics: Sign-up completion rate and core feature activation rate.
- Retention: The ongoing stage where a user returns to your platform and repeatedly utilizes your product over time. Key Metrics: Churn/retention rate, Daily Active Users (DAU), and Monthly Active Users (MAU).
- Revenue: The conversion point where a user transitions from a free user or prospect into a paying customer. Key Metrics: Free-to-paid conversion rate and Average Revenue Per User (ARPU).
- Referral: The organic growth loop where satisfied power users actively introduce others to your platform. Key Metrics: Viral K-factor and program referral rates.
Note for B2B Frameworks: If you are mapping out a enterprise-level B2B journey, your pipeline will typically require extended, high-touch stages: Lead Generation → Marketing Qualified Lead (MQL) → Sales Qualified Lead (SQL) → Pipeline Opportunity → Closed-Won Customer → Account Upsell.
Strategic Architecture Action Plan
Document this entire journey within a centralized, shared visual diagram for your organization. For every single stage of the funnel you map out, explicitly define these three elements:
- Inbound Channels: What specific growth loops or marketing channels actively drive target traffic directly into this stage?
- Nurturing Content: What localized copy, specific tool features, or offers are required to smoothly transition customers to the subsequent stage?
- Success Benchmarks: What isolated, data-driven metrics dictate whether a user has successfully completed this phase?
2. Select and Sequence Your Growth Channels
Most companies make the mistake of trying to be everywhere at once—and end up failing everywhere. A structured growth architecture forces you to ruthlessly prioritize your primary, secondary, and experimental acquisition channels based on your unique business model, customer behavior, and unit economics.
To find your focus, implement the Bullseye Framework (popularized by Gabriel Weinberg in Traction):
- Brainstorm the Options: Evaluate the 19 possible traction channels available to modern digital companies (such as SEO, content marketing, paid ads, viral loops, outbound sales, strategic partnerships, PR, and affiliate marketing).
- Filter to the Core: Narrow down and rank the top 3 to 5 channels that show the absolute highest promise for your current business stage and specific target audience.
- Run Agile Experiments: Test your chosen channels using small, strictly time-boxed experiments (for example, a $1,000 ad spend limit or a 1-month outbound outreach sprint).
- Double Down on the Winner: Focus your team’s energy entirely on the single channel that delivers the most profitable Customer Acquisition Cost to Lifetime Value (CAC/LTV) ratio.
- Scale Gradually: Only expand into a secondary channel once your primary acquisition engine is running smoothly and hitting roughly 70% of its full market potential.
Strategic Channel Sequencing Roadmap
For long-term sustainable growth, view your channels as an evolving timeline rather than a single checklist. Consider this phase-by-phase approach:
- Phase 1 (Months 0–12): Drive immediate traction using high-intent outbound sales coupled with deeply structured content marketing (such as targeted blog posts and comprehensive case studies).
- Phase 2 (Months 12–24): Accelerate inbound growth by layering on aggressive search engine optimization (SEO) and paid search campaigns (like Google Ads) to capture high-intent users looking for your specific solution.
- Phase 3 (Months 24–36): Expand market share by introducing highly targeted Account-Based Marketing (ABM) and scaling enterprise strategic partnerships.
Strategic Architecture Action Plan
Build a centralized Channel Scorecard to evaluate your growth experiments objectively. Structure your scorecard table with these critical validation metrics to clearly prioritize your next move.
3. Build Your Data & Analytics Foundation
You cannot improve what you do not measure. Yet many companies have fragmented analytics: Google Analytics for traffic, HubSpot for leads, Stripe for revenue, and no single source of truth.
A growth architecture requires a unified data layer:
- Event tracking: Use a customer data platform (CDP) like Segment or RudderStack to send every user action (page view, click, signup, purchase) to a central warehouse.
- Attribution model: Choose a model (first‑touch, last‑touch, linear, or data‑driven) that matches your sales cycle. For most B2C, multi‑touch attribution is best; for B2B with long cycles, consider full‑path attribution.
- North Star metric: A single metric that predicts long‑term success (e.g., Daily Active Users, Weekly Orders, or Qualified Leads). All teams optimize toward it.
- Metrics hierarchy:
- Lagging indicators (revenue, churn, LTV) – tell you what happened.
- Leading indicators (trial signups, demo requests, engagement score) – predict future results.
- Architecture action: Define your North Star metric and a set of 5–7 key performance indicators (KPIs) that every team reviews weekly. Ensure each KPI is tied to a specific customer journey stage.
4. Establish a Structured Experimentation System
Growth is not about guessing; it is about running disciplined experiments. The most scalable growth organizations run 10–20 experiments per week, with a clear process:
- Hypothesis: “If we change X (on landing page), then Y (conversion rate) will increase by Z%, because of reason.”
- Experiment design: A/B test, pre‑post, or cohort analysis. Determine sample size and duration.
- Execute: Implement the change (using tools like Optimizely, VWO, or custom code).
- Analyze: Compare results to control. Use statistical significance (p < 0.05).
- Decide: Ship (if winner), iterate (if inconclusive), or kill (if loser).
- Document: Record the outcome in a growth wiki for institutional memory.
Experiment velocity matters more than individual wins. A team that runs 50 experiments a year will learn slowly; a team that runs 500 will out‑compete.
Architecture action: Build a simple experiment tracker (Notion, Trello, or Airtable) with columns: Hypothesis, Owner, Status (Ideation → Running → Analyzed → Shipped/Killed), Impact, and Learnings.
5. Design Your Team & Process
Growth architecture requires a cross‑functional team that owns the entire funnel—not separate marketing, product, and data teams that rarely speak. Common growth team models:
| Model | Structure | Best for |
|---|---|---|
| Pod model | Small squads (PM, engineer, data analyst, marketer) each owning a funnel stage (acquisition, retention, etc.). | Companies with >20 growth people. |
| Center of excellence | Central growth team that runs experiments and trains other teams. | Companies where product or brand teams own execution. |
| Top‑down | A single growth leader (CGO or VP of Growth) with direct reports across functions. | Mid‑size companies ready to invest. |
Key roles in a growth team:
- Growth Product Manager: Owns the backlog and hypothesis prioritization.
- Growth Engineer: Implements experiments (landing pages, onboarding flows, emails).
- Data Analyst: Designs metrics, analyzes experiments, builds dashboards.
- Growth Marketer: Runs channel campaigns (ads, SEO, email).
- Designer (part‑time): Creates test variants.
Process rhythm:
- Daily standup (15 min): What experiments are running? Any blockers?
- Weekly prioritization (1 hour): Score new hypotheses using ICE (Impact, Confidence, Ease) or PIE (Potential, Importance, Ease).
- Weekly results review (1 hour): Review completed experiments, document learnings, update dashboards.
- Monthly planning (2 hours): Set monthly targets, allocate resources, adjust channel mix.
- Architecture action: If you are a small team (<10 people), start with a “growth lead” who owns the process, even if part‑time. Document the weekly meeting cadence in your calendar.
6. Select Your Technology Stack
The right tools enable speed and measurement. The wrong tools create data silos and friction. A minimum viable growth stack includes:
| Function | Recommended (examples) |
|---|---|
| Analytics / CDP | Segment, RudderStack, Mixpanel, Amplitude |
| Experimentation | Optimizely, VWO, Google Optimize (free), LaunchDarkly |
| CRM / Email | HubSpot, Salesforce, Customer.io, Klaviyo |
| Ads management | Facebook Ads Manager, Google Ads, AdRoll |
| SEO | Ahrefs, Semrush, Moz |
| Heatmaps / session recording | Hotjar, FullStory, Microsoft Clarity |
| BI / dashboards | Looker, Tableau, Power BI, Metabase |
Architecture action: Before adding a new tool, ask: “Does this tool connect to our central data warehouse? Can we measure ROI in under 30 days?” Avoid tool sprawl.
Common Growth Architecture Mistakes (And How to Avoid Them)
| Mistake | Why It Hurts | Avoidance |
|---|---|---|
| No shared customer journey | Teams optimize for different goals, creating a broken handoff. | Document and socialize the journey map once a quarter. |
| Trying every channel at once | Budget spreads thin; no channel reaches escape velocity. | Use the Bullseye framework; focus on one primary channel. |
| Vanity metrics | Traffic, followers, and downloads look good but don’t predict revenue. | Focus on actionable metrics (activation, retention, revenue per user). |
| No experimentation system | Decisions based on “best guess” instead of data. | Run weekly experiments, even tiny ones. |
| Disconnected data | Marketing and product see different numbers; no trust. | Unify events into a CDP and shared dashboard. |
| Hiring before process | You hire a “growth hacker” who has no framework and burns budget. | Build the architecture and simple process first, then hire to execute. |
Conclusion
Marketing & Growth Architecture is not a luxury reserved for unicorns. It is a discipline that any business can implement, starting with a single customer journey map and a weekly experiment meeting. The key is to shift from reactive marketing (doing what feels urgent) to systematic growth (designing a repeatable process that improves key metrics every week).
When you build your growth architecture before you desperately need it, you stop hoping for growth—and start engineering it.